HARMONACCI PATTERNS INDICATOR FOR METATRADER

Trade smarter, not harder: empower your trading with harmonacci patterns

If you're tired of chasing trades and second-guessing chart noise, this tool flips the script. Harmonacci Patterns does the heavy lifting: it hunts down 19 powerful harmonic price formations, draws the key reversal zones, and signals the breakout only when the setup makes sense.

  • Spots 19 powerful harmonic patterns — Even the rare and complex ones.
  • Draws the Potential Reversal Zone (PRZ) — Where price should reverse.
  • Breakout confirmation before entry — No signal until price proves it.
  • Self-analyzing indicator — See how it's performing over time.
  • Alerts you your way — Visual, email, sound, push.
  • Fully customizable ratios, projections, and visuals.
  • Auto-plots SL/TP levels — Takes the thinking out.
  • Shows past patterns — Learn from history.

Screenshots

Description

This is one of the most complete automatic harmonic pattern detection tools available for the MetaTrader platform. It recognizes 19 different harmonic price formations, uses Fibonacci projections with precision, shows the Potential Reversal Zone (PRZ), and gives stop-loss and take-profit levels.

  • Detects 19 different harmonic price formations
  • Shows PRZ using primary, derived, and complementary Fibonacci projections
  • Reviews past price action and displays all past patterns
  • Analyzes its own quality and performance
  • Shows suggested stop-loss and take-profit levels
  • Uses breakouts to confirm and signal trading opportunities
  • Displays all pattern ratios on the chart
  • Sends alerts by email, sound, push notification, or on-screen

Important: Some pattern names have been renamed to self-explanatory alternatives to comply with a trademark complaint from Mr. Scott M. Carney, who owns the following trademarks in the USA: Harmonics, Harmonic Trading, Bat Pattern, Butterfly Pattern, Shark Pattern, Crab Pattern and Five-O Pattern.

  • Fibonacci projections are vector-independent
  • It implements email/sound/push alerts
  • It plots the ABCD projection

Supported Harmonic Patterns

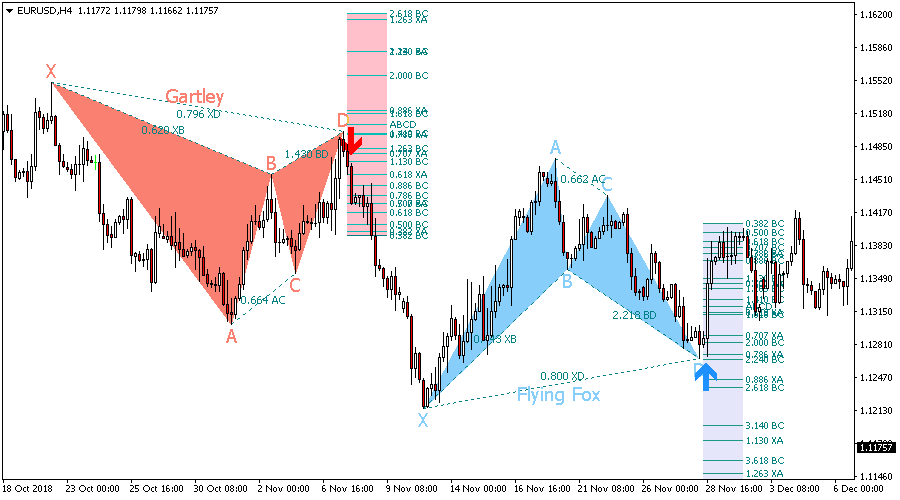
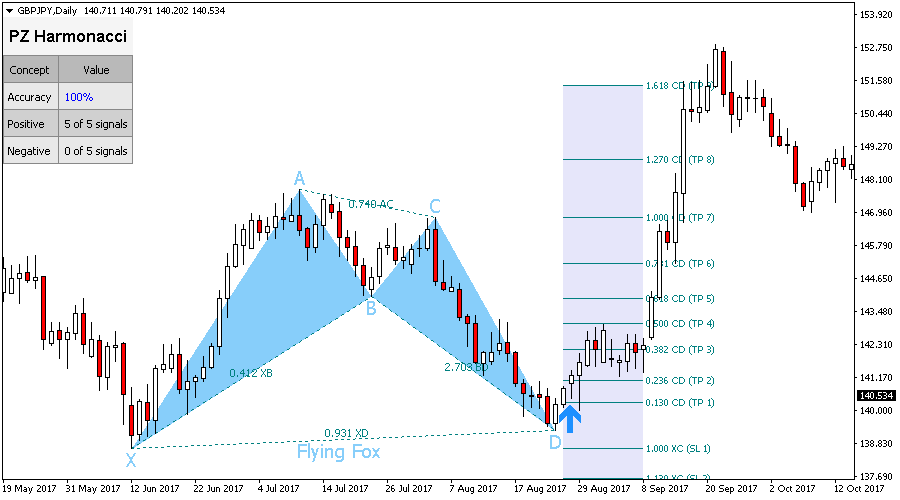
  • Flying Fox: XB 0.382–0.5, AC 0.382–0.886, DB 1.618–2.618, XD 0.886
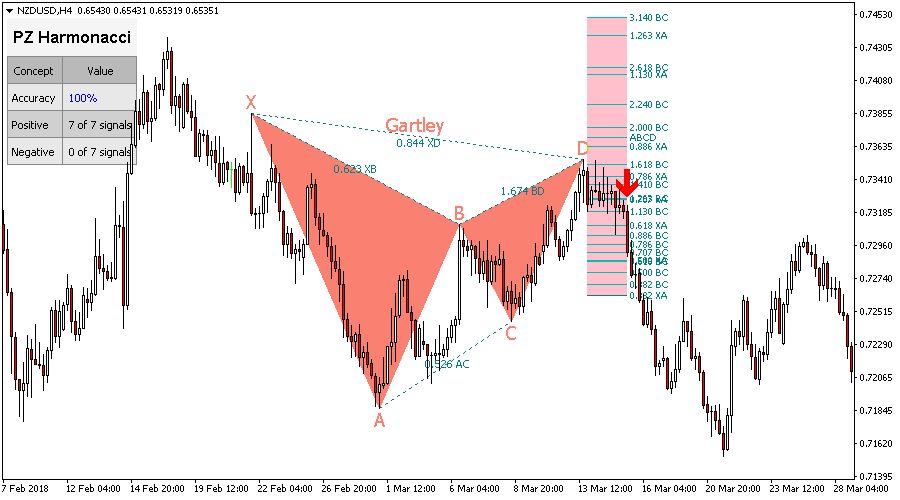
  • Gartley: XB 0.618, AC 0.382–0.886, DB 1.272–1.618, XD 0.786
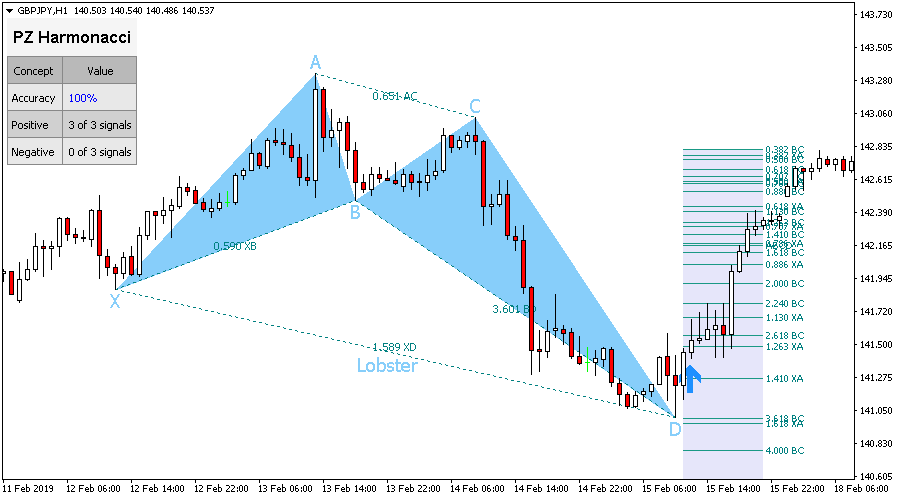
  • Lobster: XB 0.382–0.618, AC 0.382–0.886, DB 2.24–3.618, XD 1.618
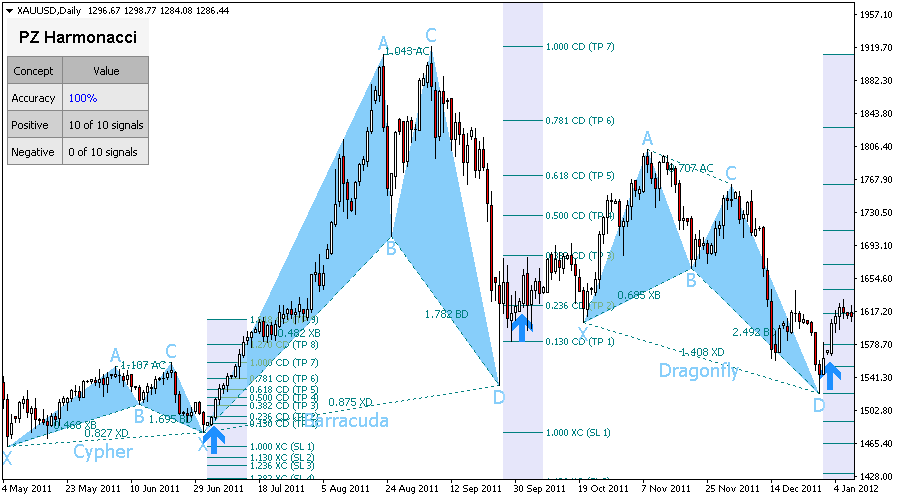
  • Dragonfly: XB 0.718, AC 0.382–0.886, DB 1.618–2.618, XD 1.272–1.618
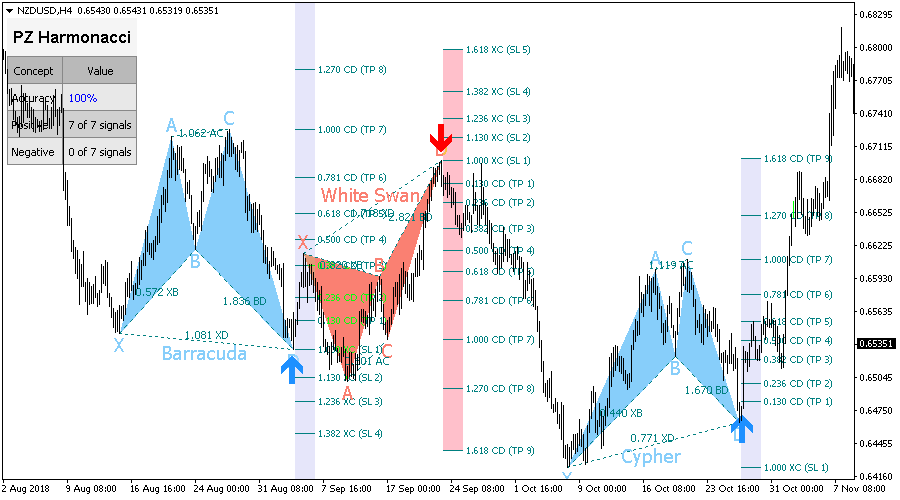
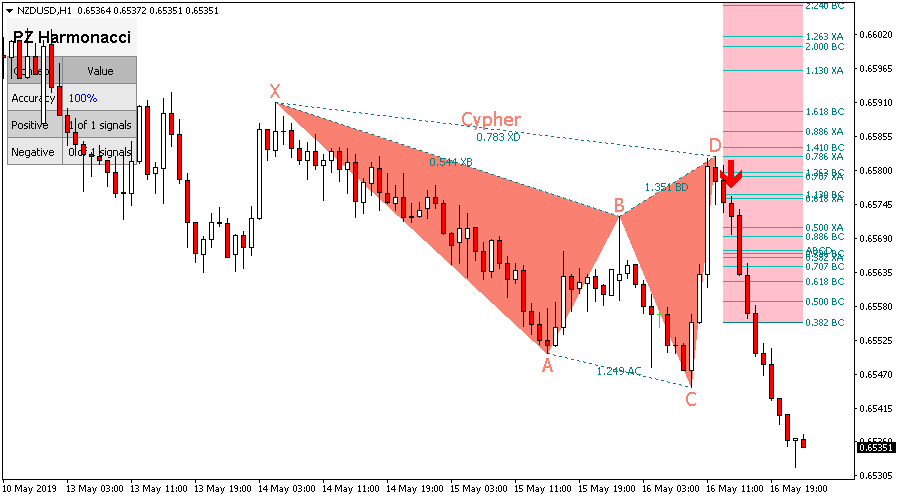
  • Cypher: XB 0.382–0.618, AC 1.13–1.414, DB 1.272–2.0, XD 0.786
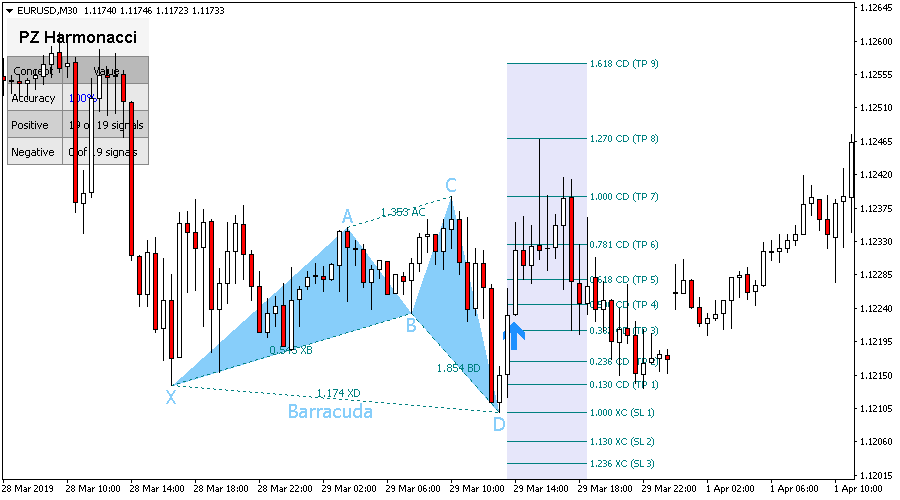
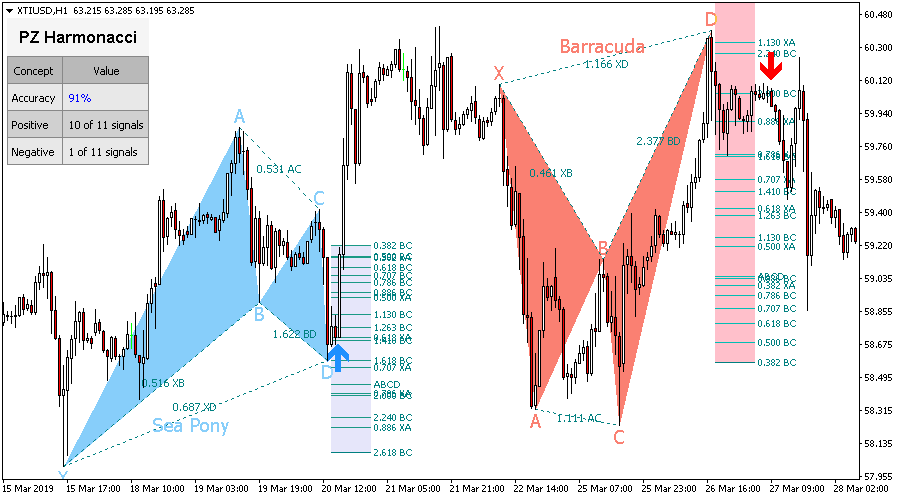
  • Barracuda: XB –, AC 1.13–1.618, DB 1.618–2.24, XD 0.886–1.13
  • Alt Flying Fox: XB 0.382, AC 0.382–0.886, DB 2.0–3.618, XD 1.13
  • Deep Lobster: XB 0.886, AC 0.382–0.886, DB 2.618–3.618, XD 1.618
  • White Swan: XB 1.382–2.618, AC 0.236–0.5, DB 1.128–2.0, XD 1.126–2.618
  • Black Swan: XB 0.382–0.724, AC 2.0–4.237, DB 0.5–0.886, XD 0.382–0.886
  • Max Bat: XB 0.382–0.618, AC 0.382–0.886, DB 1.272–2.618, XD 0.886
  • Max Gartley: XB 0.382–0.618, AC 0.382–0.886, DB 1.128–2.236, XD 0.618–0.786
  • Max Dragonfly: XB 0.618–0.886, AC 0.382–0.886, DB 1.272–2.618, XD 1.272–1.618
  • Alt Barracuda: XB 0.446–0.618, AC 0.618–0.886, DB 1.618–2.618, XD 1.128
  • A Lobster: XB 0.276–0.446, AC 1.128–2.618, DB 1.618–2.618, XD 0.618
  • A Dragonfly: XB 0.382–0.618, AC 1.128–2.618, DB 1.272, XD 0.618–0.786
  • A Flying Fox: XB 0.382–0.618, AC 1.128–2.618, DB 2.0–2.618, XD 1.128
  • A Gartley: XB 0.618–0.786, AC 1.128–2.618, DB 1.618, XD 1.272
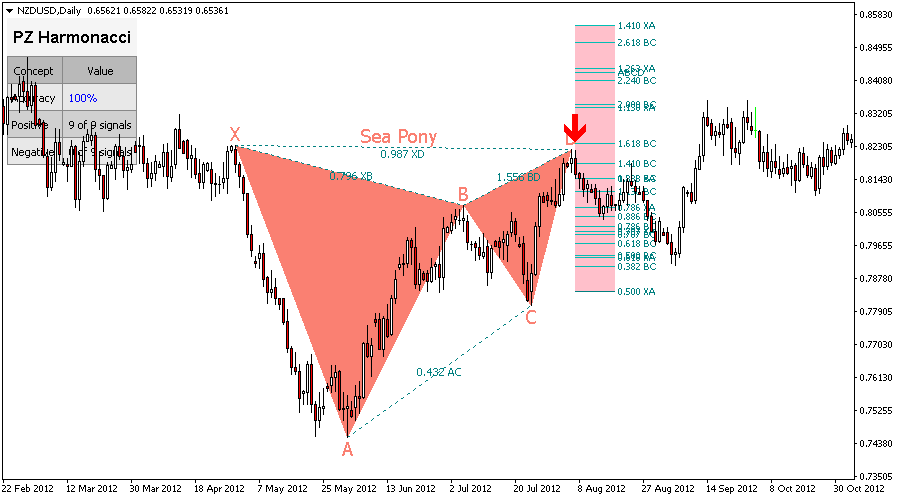
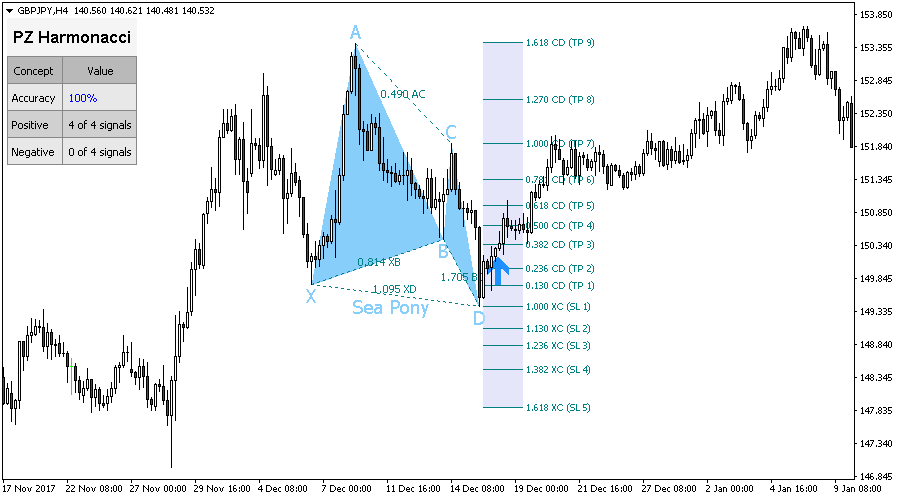
  • Sea Pony: XB 0.128–3.618, AC 0.382–0.5, DB 1.618–2.618, XD 0.618–3.618

Input Parameters

  • Amplitude - This parameter controls the size of the patterns to be found in the chart.
  • Deviation - Algorithmic wiggle room for pattern recognition. Increase it to find more patterns.
  • Breakout Period - Donchian breakout period for the trading signals.
  • Max History Bars - Amount of history bars to evaluate when the indicator loads.
  • Display Stats - Enable or disable performance screen stats.
  • Display Points - Display price point labels (X, A, B, C, D labels).
  • Display Ratios - Display pattern ratios.
  • Display Projections - Display the Potential Reversal Zone (PRZ)
  • Display SL/TP Levels - Display suitable stop-loss and take-profit levels.
  • Pattern Settings - Choose what patterns to scan for: disable all those you do not use.
  • Drawing Settings - Configure the colors of bullish and bearish patterns, as well as font sizes.
  • Ratios - Enable or disable ratios and choose your own ratio colors.
  • Projections - Display or hide the Fibonacci projections on the chart.
  • Breakouts - Enable or disable breakouts, and set your desired arrow sizes and colors.
  • Alerts - Enable display/email/push/sound alerts for breakouts, patterns or both

Reviews

Verified reviews from third party sources
kylewisani
From MQL5

Good one. Better than all other indicators you have.

⭐⭐⭐⭐
Sabu John
From MQL5

Very accurate signals.

⭐⭐⭐⭐
Oliver F.
From Forex Peace Army

I’m a veteran and have seen a lot of garbage, but this is by far one of the most useful tools I’ve come across. I rarely leave reviews, but this one truly deserves it.

⭐⭐⭐⭐⭐
Nancy Hurte
From Forex Peace Army

The Harmonic Pattern tool works best on higher timeframes. With the right setup and patience, it delivers great signals. Support is quick and helpful.

⭐⭐⭐⭐⭐
Ahmad Adnan
From Forex Peace Army

I’ve used this indicator for 7 months. It’s extremely helpful and has made a noticeable difference in my results. I never trade without it anymore.

⭐⭐⭐⭐⭐
Tushar S.
From Forex Peace Army

PZ indicators truly deliver. My Harmonics tool gave me 81% return in month one. Now my wife trades with them too. Just great tools!

⭐⭐⭐⭐⭐
Michael M.
From MQL5

PZ Harmonnaci is easy to use and has great customization options. It’s not a signal generator, but a perfect strategy companion.

⭐⭐⭐⭐⭐
Pisethata Keo
From MQL5

PZ Harmonic changed my trading. I earned over 100 pips in just four days while keeping risk low. Finally enjoying my trades!

⭐⭐⭐⭐⭐
Etienne Hogue
From MQL5

Bought the Harmonic indicator, placed two trades the first night, and gained 40 pips on each. So far, it’s looking very promising.

⭐⭐⭐⭐⭐

Related Indicators & Bots

Frequently Asked Questions

The Harmonacci Patterns indicator is a comprehensive harmonic pattern recognition tool for MetaTrader that automatically detects 19 distinct price formations based on Fibonacci ratios. It stands out by incorporating Donchian breakouts for signal confirmation, enhancing trade reliability. In addition, it visualizes the Potential Reversal Zone (PRZ), plots stop-loss and take-profit levels, and offers historical pattern tracking with detailed ratio and projection overlays.

Signals are triggered when a completed harmonic pattern is followed by a Donchian breakout in the expected direction. This two-stage filtering process helps reduce false signals and aligns with more disciplined, rule-based trading strategies.

The PRZ is a key confluence area where multiple Fibonacci retracement and extension levels intersect, indicating a likely price reversal. The Harmonacci Patterns indicator calculates and displays this zone using vector-independent projections aligned with the specific harmonic structure, allowing traders to visually assess high-probability turning points.

Absolutely. You can choose which harmonic patterns to scan for, modify the colors for bullish and bearish formations, change the size and style of chart labels, and toggle the visibility of Fibonacci ratios, projections, and SL/TP levels. Alerts and breakout visuals can also be tailored to your preference.

Yes, the indicator can repaint in certain situations. If a pattern is still forming and a Donchian breakout is not definitive, the pattern may continue expanding and adjust its structure dynamically. This behavior is intentional and aligns with real-time market evolution, but traders should be aware that signals may change if a breakout fails or the pattern does not finalize.

Some of our indicators perform deep analysis of price history, especially those that calculate Fibonacci levels, structure, or multiple signal legs. If it feels slow to load, try lowering the "Max History Bars" setting in the input parameters. This limits how far back the indicator analyzes and improves responsiveness.

The indicator provides sound, visual, email, and push notifications. You can enable alerts for the appearance of new patterns, confirmed breakouts, or both. This ensures you're promptly informed of trading opportunities, even when you're away from the chart.

The indicator is heavily inspired by the harmonic trading methodology introduced by Scott M. Carney. However, due to trademark restrictions, some pattern names have been changed to more self explanatory alternatives. Despite the renaming, the underlying structure and Fibonacci logic of the patterns remain faithful to the original concepts.