Volatmeter 2.2
Metatrader Indicator (MT4/MT5)
-
ℹ Overview
This indicator measures volatility in a multi-timeframe fashion aiming at identifying flat markets, volatility spikes and price movement cycles in the market. It's not the easiest volatility indicator to interpret, but certainly a very powerful one.
- Trade when volatility is on your side
- Identify short-term volatility and price spikes
- Find volatility cycles at a glance
- The indicator is non-repainting
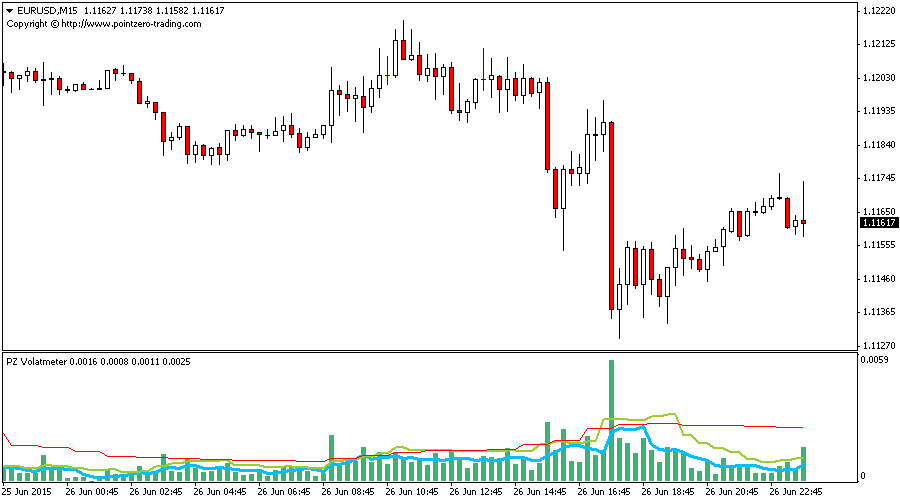
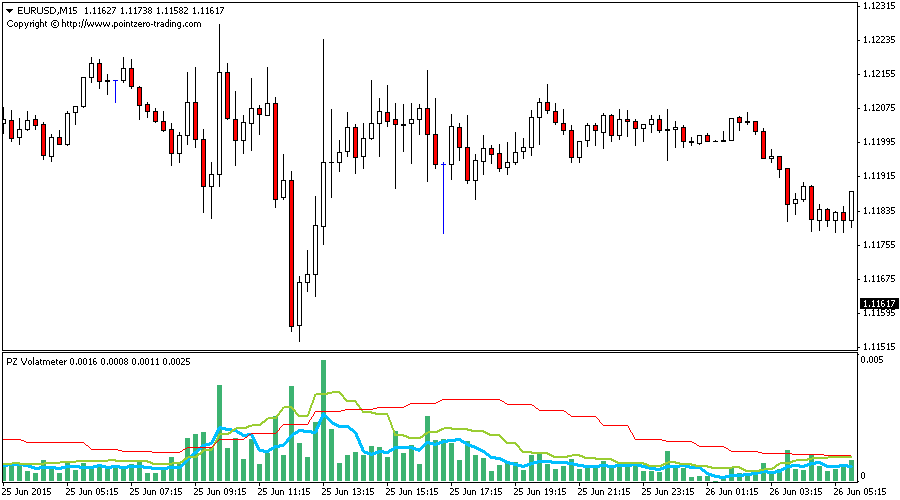
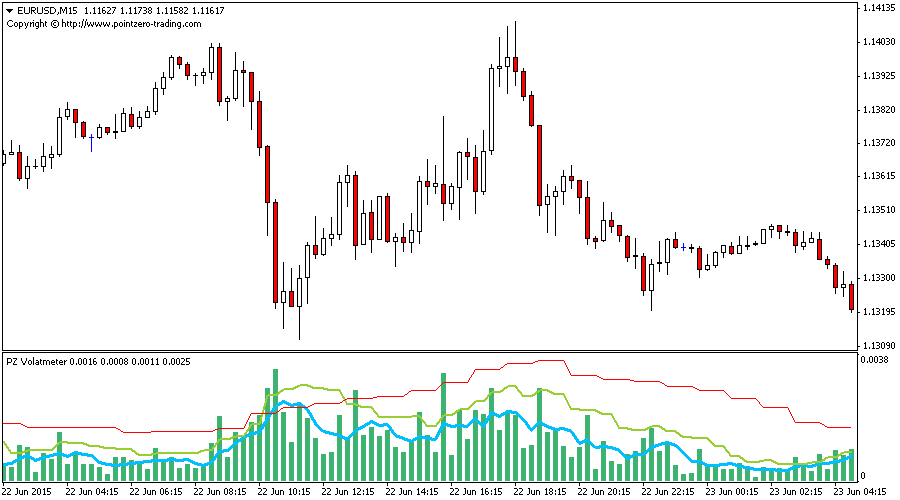
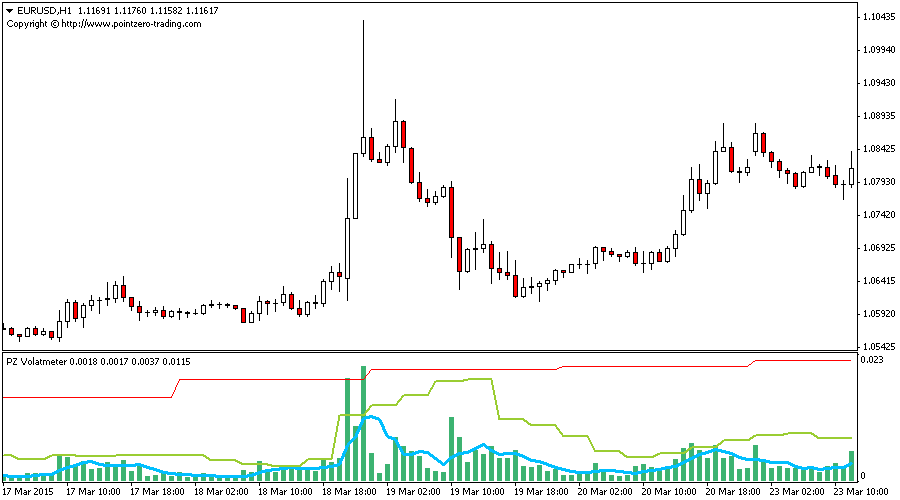
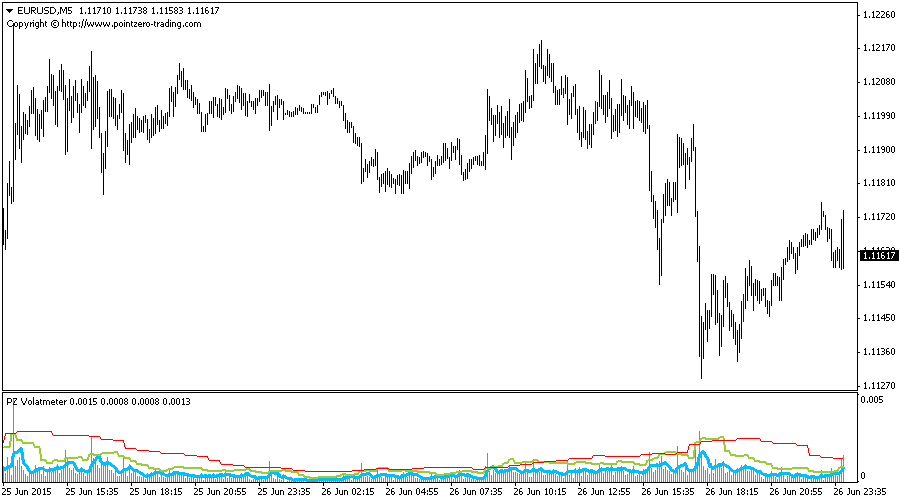
The ingredients of the indicator are the following...
- The green histogram is the current bar volatility
- The blue line is the fast volatility value
- The orange line is the slow volatility value
- The red line is the higher timeframe volatility
...and have straightforward trading implications:
- If the green histogram is above two lines, short-term volatility is extreme
- If the blue line is above the orange line, volatility is generally high
- If the orange line if above the red line, the market volatility is high
- Zoom out in the chart to see the volatility cycle reflected on the red line
- ≡
Input parameters
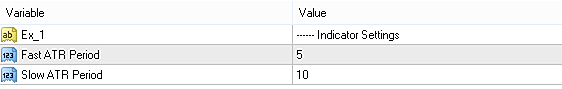
When loading the expert to any chart, you will be presented with a set of options as input parameters. Don't despair if you think they are too many, because parameters are grouped into self-explanatory blocks.
- Fast ATR Period
- ATR period for the current timeframe
- Slow ATR Period
- ATR period for higher timeframes
- ?
FAQ
- Does the indicator repaint?
- No, it does not!
- What is the green histogram?
- The green bars represent the volatility of the current bar only.
Screenshots