Synthetic Chart 1.0
Metatrader Indicator (MT4/MT5)
-
ℹ Overview
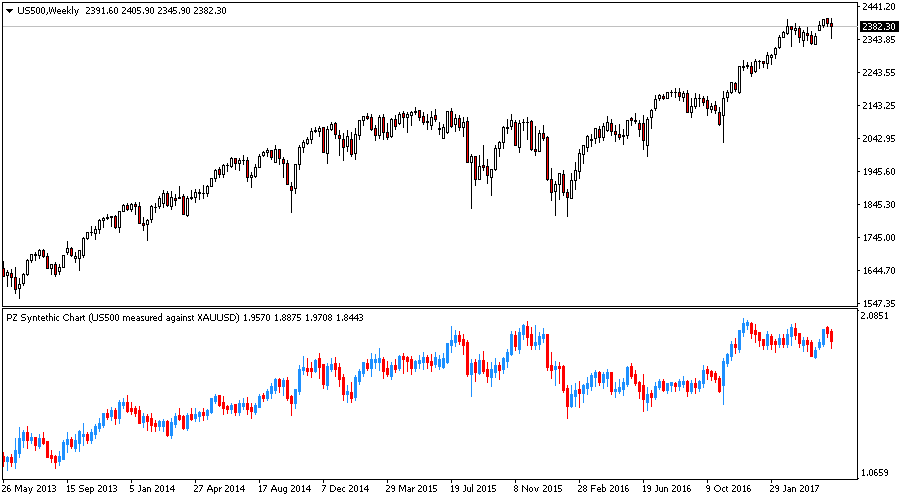
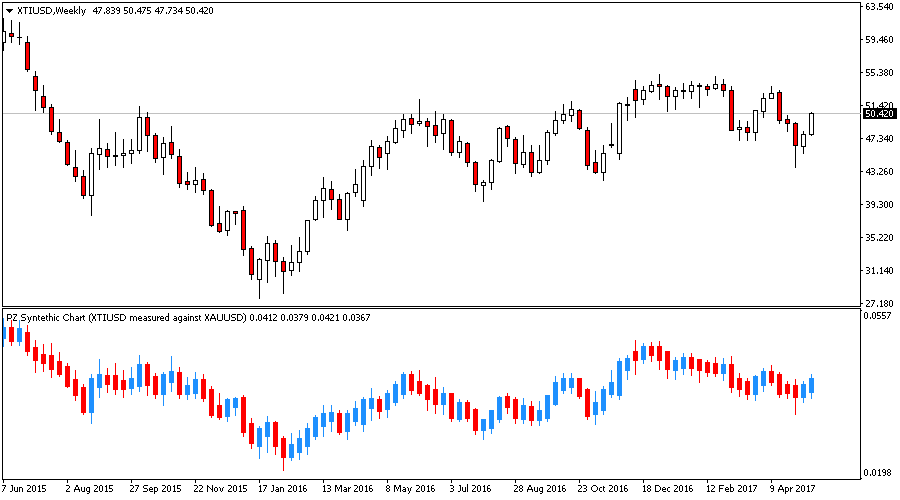
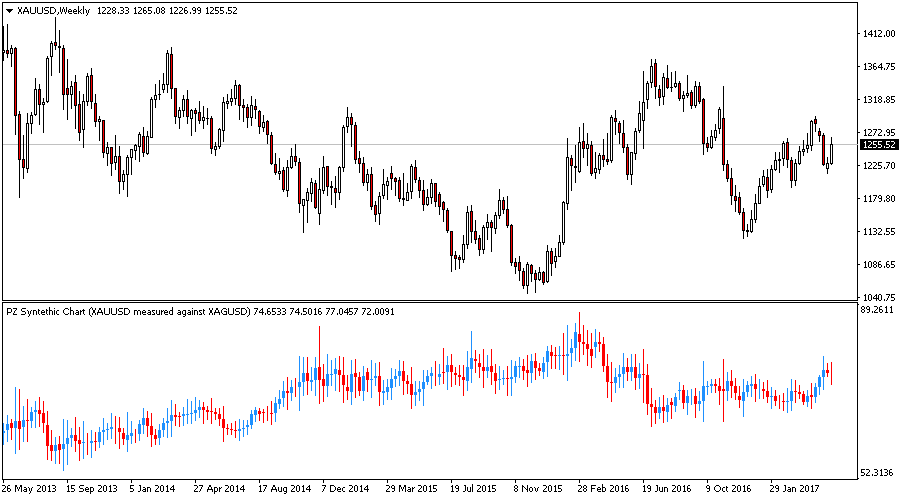
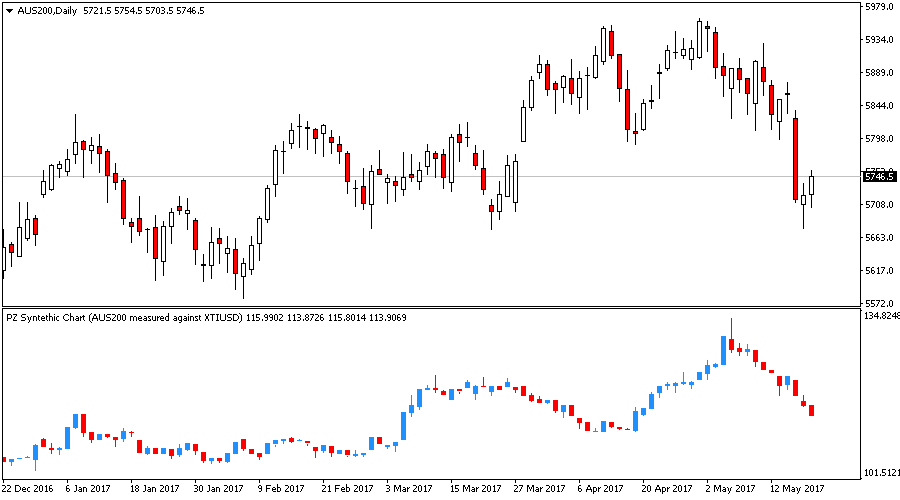
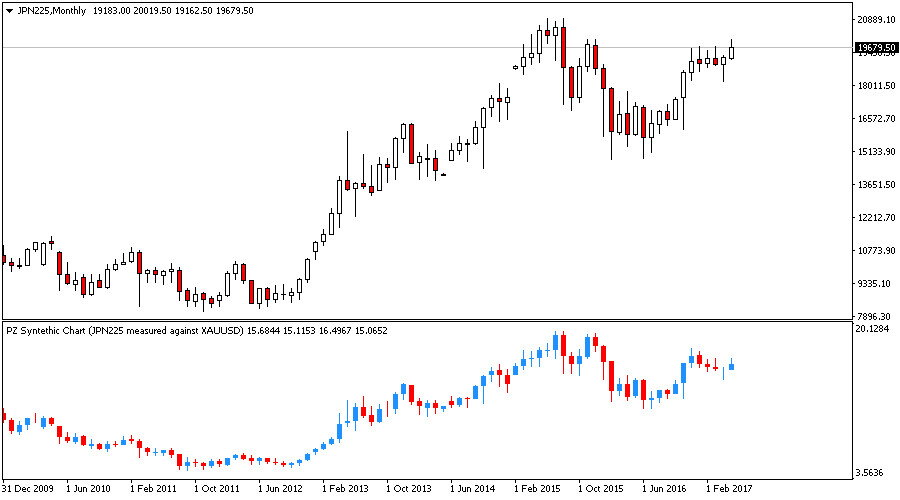
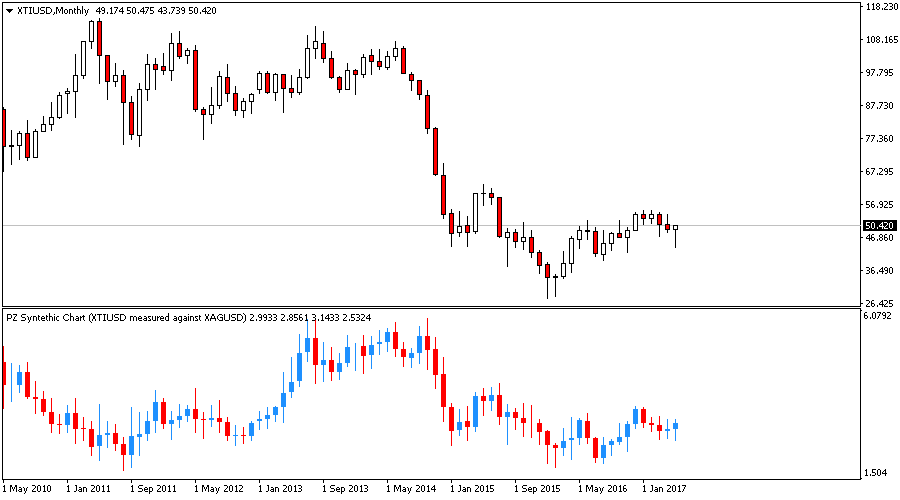
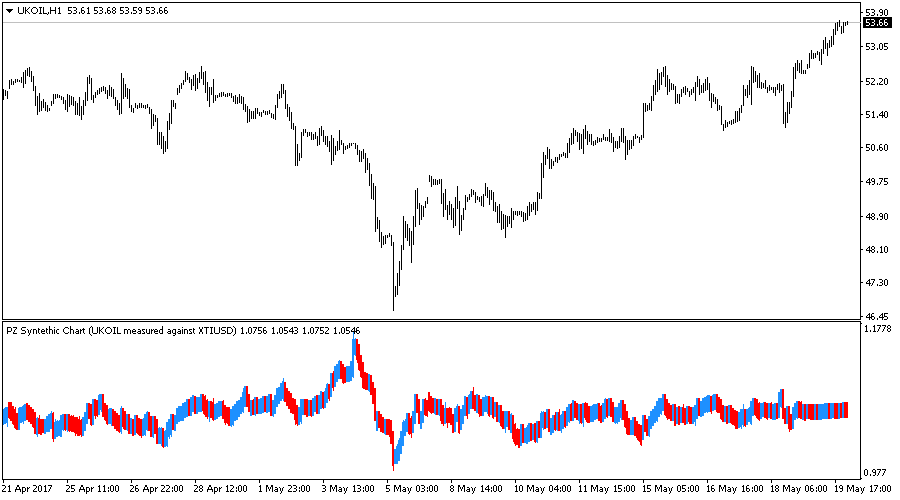
This indicator creates synthetic charts. It creates a candlestick chart plotting the price of one instrument measured against another, helping you to find hidden opportunities in the market crossing relationships between different instruments.
- Find hidden trading opportunities
- Get a broader sense of the price of commodities
- Commodities range against each other and are easier to trade
- Correlated Indices can be traded against each other easily
- Your imagination is the limit with this indicator
For instance, this indicator can plot....
- The price of Dow Jones in Gold Ounzes
- The price of Nasdaq in SP500 shares
- The price of Oil in Silver Ounzes
- The price of Oil in bushels of Corn
- The price of Cattle in tonnes of Copper
- And endless combinations!
For the indicator to display properly, please run on a white chart template or change the indicator white buffers to black.
- ≡
Input parameters
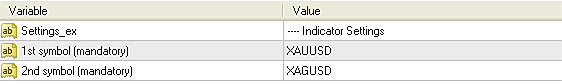
When loading the expert to any chart, you will be presented with a set of options as input parameters. Don't despair if you think they are too many, because parameters are grouped into self-explanatory blocks.
- 1st Symbol
- Type the native symbol of the chart to be plotted. For example, XAUUSD.
- 2nd Symbol
- Type the reference symbol of the chart to be plotted. For example, XAGUSD.
- ?
FAQ
- Does the indicator repaint?
- No, it does not. Once a bar closes, it will not repaint.
- How can I trade a synthetic chart?
- You trade a synthetic chart by going long one symbol and short the opposite symbol, effectively selling one and buying the other simultaneously, just like you do with a forex pair, but with a single trade.
Screenshots